Tables and Visualizations
Median Salary Table
Year | All Employees | Non-Visible Minority Employees | Visible Minority Employees | Black Employees | Indigenous Employees | Employees with Disabilities |
|---|---|---|---|---|---|---|
2024 | 85,650 | 86,500 | 83,050 | 77,000 | 83,350 | 84,400 |
2023 | 80,850 | 82,100 | 77,000 | 71,200 | 78,100 | 77,800 |
2022 | 81,300 | 82,050 | 78,350 | 71,800 | 78,400 | 78,000 |
2021 | 79,900 | 80,450 | 77,100 | 71,150 | 77,450 | 77,050 |
2020 | 76,900 | 77,500 | 74,250 | 67,250 | 73,350 | 73,100 |
2019 | 75,750 | 76,200 | 73,650 | 67,450 | 72,400 | 72,700 |
2018 | 72,450 | 72,550 | 71,950 | 68,500 | 70,450 | 71,200 |
2017 | 69,550 | 69,600 | 69,250 | 65,450 | 67,250 | 67,800 |
Median salaries (CDN per annum) of Canadian core public service employees from 2017-2024, rounded to the nearest $50. Median salary was estimated with Formula 1. Orange values indicate a higher value than the “all employees” group, and blue values indicate a lower value per year. Data from Treasury Board of Canada Secretariat Diversity and Inclusion Statistics.
Disproportionality Tables
| All Employees | Black Employees | All Visible Minority Employees | Non-Visible Minority Employees | Indigenous Employees | Employees with Disabilities | ||||||
|---|---|---|---|---|---|---|---|---|---|---|---|---|
Salary Range | Percent | DI | Percent | DI | Percent | DI | Percent | DI | Percent | DI | Percent | DI |
Less than $69,999 | 23.87 | 1 | 34.78 | 1.46 | 27.26 | 1.14 | 22.86 | 0.96 | 24.80 | 1.04 | 25.84 | 1.08 |
$70,000 to $79,999 | 16.75 | 1 | 20.14 | 1.20 | 17.68 | 1.06 | 16.48 | 0.98 | 18.49 | 1.10 | 16.98 | 1.01 |
$80,000 to $94,999 | 19.51 | 1 | 17.46 | 0.89 | 18.37 | 0.94 | 19.85 | 1.02 | 21.08 | 1.08 | 17.45 | 0.89 |
$95,000 to $109,999 | 16.65 | 1 | 12.76 | 0.77 | 15.78 | 0.95 | 16.90 | 1.02 | 17.49 | 1.05 | 16.30 | 0.98 |
Over $110,000 | 23.22 | 1 | 14.86 | 0.64 | 20.90 | 0.90 | 23.91 | 1.03 | 18.15 | 0.78 | 23.44 | 1.01 |
All ranges | 100.00 | 1 | 100.00 | 1.00 | 100.00 | 1.00 | 100.00 | 1.00 | 100.00 | 1.00 | 100.00 | 1.00 |
| All Employees | Black Employees | All Visible Minority Employees | Non-Visible Minority Employees | Indigenous Employees | Employees with Disabilities | ||||||
|---|---|---|---|---|---|---|---|---|---|---|---|---|
Salary Range | Percent | DI | Percent | DI | Percent | DI | Percent | DI | Percent | DI | Percent | DI |
Less than $65,000 | 23.77 | 1 | 35.35 | 1.49 | 26.82 | 1.13 | 22.92 | 0.96 | 25.64 | 1.08 | 27.36 | 1.15 |
$65,000 to $74,999 | 19.14 | 1 | 23.09 | 1.21 | 20.81 | 1.09 | 18.68 | 0.98 | 19.84 | 1.04 | 19.13 | 1.00 |
$75,000 to $89,999 | 19.63 | 1 | 16.41 | 0.84 | 17.89 | 0.91 | 20.11 | 1.02 | 21.60 | 1.10 | 17.22 | 0.88 |
$90,000 to $104,999 | 17.30 | 1 | 12.43 | 0.72 | 16.16 | 0.93 | 17.61 | 1.02 | 17.98 | 1.04 | 17.26 | 1.00 |
Over $150,000 | 20.16 | 1 | 12.72 | 0.63 | 18.32 | 0.91 | 20.67 | 1.03 | 14.94 | 0.74 | 19.03 | 0.94 |
All ranges | 100.00 | 1 | 100.00 | 1.00 | 100.00 | 1.00 | 100.00 | 1.00 | 100.00 | 1.00 | 100.00 | 1.00 |
| All Employees | Black Employees | All Visible Minority Employees | Non-Visible Minority Employees | Indigenous Employees | Employees with Disabilities | ||||||
|---|---|---|---|---|---|---|---|---|---|---|---|---|
Salary Range | Percent | DI | Percent | DI | Percent | DI | Percent | DI | Percent | DI | Percent | DI |
Less than $60,000 | 15.36 | 1 | 21.38 | 1.39 | 16.17 | 1.05 | 15.15 | 0.99 | 17.02 | 1.11 | 17.44 | 1.14 |
$60,000 to $69,999 | 17.28 | 1 | 24.66 | 1.43 | 19.58 | 1.13 | 16.69 | 0.97 | 17.74 | 1.03 | 18.69 | 1.08 |
$70,000 to $84,999 | 21.03 | 1 | 20.52 | 0.98 | 20.57 | 0.98 | 21.15 | 1.01 | 22.67 | 1.08 | 20.13 | 0.96 |
$85,000 to $99,999 | 21.27 | 1 | 16.45 | 0.77 | 20.29 | 0.95 | 21.51 | 1.01 | 23.56 | 1.11 | 20.04 | 0.94 |
Over $100,000 | 25.06 | 1 | 16.98 | 0.68 | 23.22 | 0.93 | 25.53 | 1.02 | 19.01 | 0.76 | 23.71 | 0.95 |
All ranges | 100.00 | 1 | 100.00 | 1.00 | 100.00 | 1.00 | 100.00 | 1.00 | 100.00 | 1.00 | 100.00 | 1.00 |
| All Employees | Black Employees | All Visible Minority Employees | Non-Visible Minority Employees | Indigenous Employees | Employees with Disabilities | ||||||
|---|---|---|---|---|---|---|---|---|---|---|---|---|
Salary Range | Percent | DI | Percent | DI | Percent | DI | Percent | DI | Percent | DI | Percent | DI |
Less than $60,000 | 13.97 | 1 | 21.04 | 1.51 | 15.58 | 1.12 | 13.60 | 0.97 | 15.03 | 1.08 | 15.12 | 1.08 |
$60,000 to $69,999 | 17.14 | 1 | 23.35 | 1.36 | 19.29 | 1.13 | 16.65 | 0.97 | 18.16 | 1.06 | 18.75 | 1.09 |
$70,000 to $84,999 | 22.60 | 1 | 20.49 | 0.91 | 21.63 | 0.96 | 22.82 | 1.01 | 23.87 | 1.06 | 20.47 | 0.91 |
$85,000 to $99,999 | 18.85 | 1 | 15.38 | 0.82 | 18.32 | 0.97 | 18.97 | 1.01 | 21.43 | 1.14 | 18.64 | 0.99 |
Over $100,000 | 22.75 | 1 | 15.41 | 0.68 | 21.27 | 0.93 | 23.10 | 1.02 | 16.63 | 0.73 | 21.26 | 0.93 |
All ranges | 100.00 | 1 | 100.00 | 1.00 | 100.00 | 1.00 | 100.00 | 1.00 | 100.00 | 1.00 | 100.00 | 1.00 |
| All Employees | Black Employees | All Visible Minority Employees | Non-Visible Minority Employees | Indigenous Employees | Employees with Disabilities | ||||||
|---|---|---|---|---|---|---|---|---|---|---|---|---|
Salary Range | Percent | DI | Percent | DI | Percent | DI | Percent | DI | Percent | DI | Percent | DI |
Less than $60,000 | 23.82 | 1 | 34.75 | 1.46 | 25.61 | 1.08 | 23.43 | 0.98 | 26.57 | 1.12 | 26.85 | 1.13 |
$60,000 to $69,999 | 17.56 | 1 | 19.78 | 1.13 | 18.66 | 1.06 | 17.32 | 0.99 | 18.43 | 1.05 | 18.64 | 1.06 |
$70,000 to $84,999 | 19.84 | 1 | 16.32 | 0.82 | 18.55 | 0.93 | 20.11 | 1.01 | 22.93 | 1.16 | 17.39 | 0.88 |
$85,000 to $99,999 | 18.32 | 1 | 15.36 | 0.84 | 17.87 | 0.98 | 18.42 | 1.01 | 18.26 | 1.00 | 19.07 | 1.04 |
Over $100,000 | 20.47 | 1 | 13.79 | 0.67 | 19.31 | 0.94 | 20.72 | 1.01 | 13.80 | 0.67 | 18.05 | 0.88 |
All ranges | 100.00 | 1 | 100.00 | 1.00 | 100.00 | 1.00 | 100.00 | 1.00 | 100.00 | 1.00 | 100.00 | 1.00 |
| All Employees | Black Employees | All Visible Minority Employees | Non-Visible Minority Employees | Indigenous Employees | Employees with Disabilities | ||||||
|---|---|---|---|---|---|---|---|---|---|---|---|---|
Salary Range | Percent | DI | Percent | DI | Percent | DI | Percent | DI | Percent | DI | Percent | DI |
Less than $60,000 | 25.20 | 1 | 36.60 | 1.45 | 27.74 | 1.10 | 24.69 | 0.98 | 27.87 | 1.11 | 28.50 | 1.13 |
$60,000 to $69,999 | 17.13 | 1 | 17.66 | 1.03 | 17.51 | 1.02 | 17.06 | 1.00 | 18.47 | 1.08 | 17.30 | 1.01 |
$70,000 to $84,999 | 21.41 | 1 | 17.36 | 0.81 | 19.73 | 0.92 | 21.75 | 1.02 | 24.32 | 1.14 | 18.89 | 0.88 |
$85,000 to $99,999 | 17.96 | 1 | 16.28 | 0.91 | 17.72 | 0.99 | 18.01 | 1.00 | 17.33 | 0.96 | 18.56 | 1.03 |
Over $100,000 | 18.30 | 1 | 12.11 | 0.66 | 17.31 | 0.95 | 18.50 | 1.01 | 12.02 | 0.66 | 16.75 | 0.92 |
All ranges | 100.00 | 1 | 100.00 | 1.00 | 100.00 | 1.00 | 100.00 | 1.00 | 100.00 | 1.00 | 100.00 | 1.00 |
| All Employees | Black Employees | All Visible Minority Employees | Non-Visible Minority Employees | Indigenous Employees | Employees with Disabilities | ||||||
|---|---|---|---|---|---|---|---|---|---|---|---|---|
Salary Range | Percent | DI | Percent | DI | Percent | DI | Percent | DI | Percent | DI | Percent | DI |
Less than $60,000 | 25.87 | 1 | 34.69 | 1.34 | 28.09 | 1.09 | 25.45 | 0.98 | 28.69 | 1.11 | 28.80 | 1.11 |
$60,000 to $69,999 | 19.40 | 1 | 17.95 | 0.93 | 18.71 | 0.96 | 19.53 | 1.01 | 19.99 | 1.03 | 18.83 | 0.97 |
$70,000 to $84,999 | 19.94 | 1 | 18.56 | 0.93 | 18.62 | 0.93 | 20.18 | 1.01 | 23.68 | 1.19 | 18.46 | 0.93 |
$85,000 to $99,999 | 16.93 | 1 | 16.02 | 0.95 | 17.18 | 1.01 | 16.88 | 1.00 | 16.22 | 0.96 | 17.60 | 1.04 |
Over $100,000 | 17.87 | 1 | 12.78 | 0.72 | 17.40 | 0.97 | 17.95 | 1.00 | 11.42 | 0.64 | 16.31 | 0.91 |
All ranges | 100.00 | 1 | 100.00 | 1.00 | 100.00 | 1.00 | 100.00 | 1.00 | 100.00 | 1.00 | 100.00 | 1.00 |
| All Employees | Black Employees | All Visible Minority Employees | Non-Visible Minority Employees | Indigenous Employees | Employees with Disabilities | ||||||
|---|---|---|---|---|---|---|---|---|---|---|---|---|
Salary Range | Percent | DI | Percent | DI | Percent | DI | Percent | DI | Percent | DI | Percent | DI |
Less than $55,000 | 23.74 | 1 | 31.81 | 1.34 | 25.42 | 1.07 | 23.44 | 0.99 | 27.36 | 1.15 | 27.22 | 1.15 |
$55,000 to $64,999 | 17.53 | 1 | 17.48 | 1.00 | 17.13 | 0.98 | 17.60 | 1.00 | 18.15 | 1.04 | 17.78 | 1.01 |
$65,000 to $79,999 | 22.66 | 1 | 20.43 | 0.90 | 21.09 | 0.93 | 22.94 | 1.01 | 25.91 | 1.14 | 19.57 | 0.86 |
$80,000 to $94,999 | 17.66 | 1 | 16.62 | 0.94 | 18.17 | 1.03 | 17.57 | 0.99 | 17.01 | 0.96 | 18.49 | 1.05 |
Over $95,000 | 18.42 | 1 | 13.66 | 0.74 | 18.20 | 0.99 | 18.46 | 1.00 | 11.58 | 0.63 | 16.94 | 0.92 |
All ranges | 100.00 | 1 | 100.00 | 1.00 | 100.00 | 1.00 | 100.00 | 1.00 | 100.00 | 1.00 | 100.00 | 1.00 |
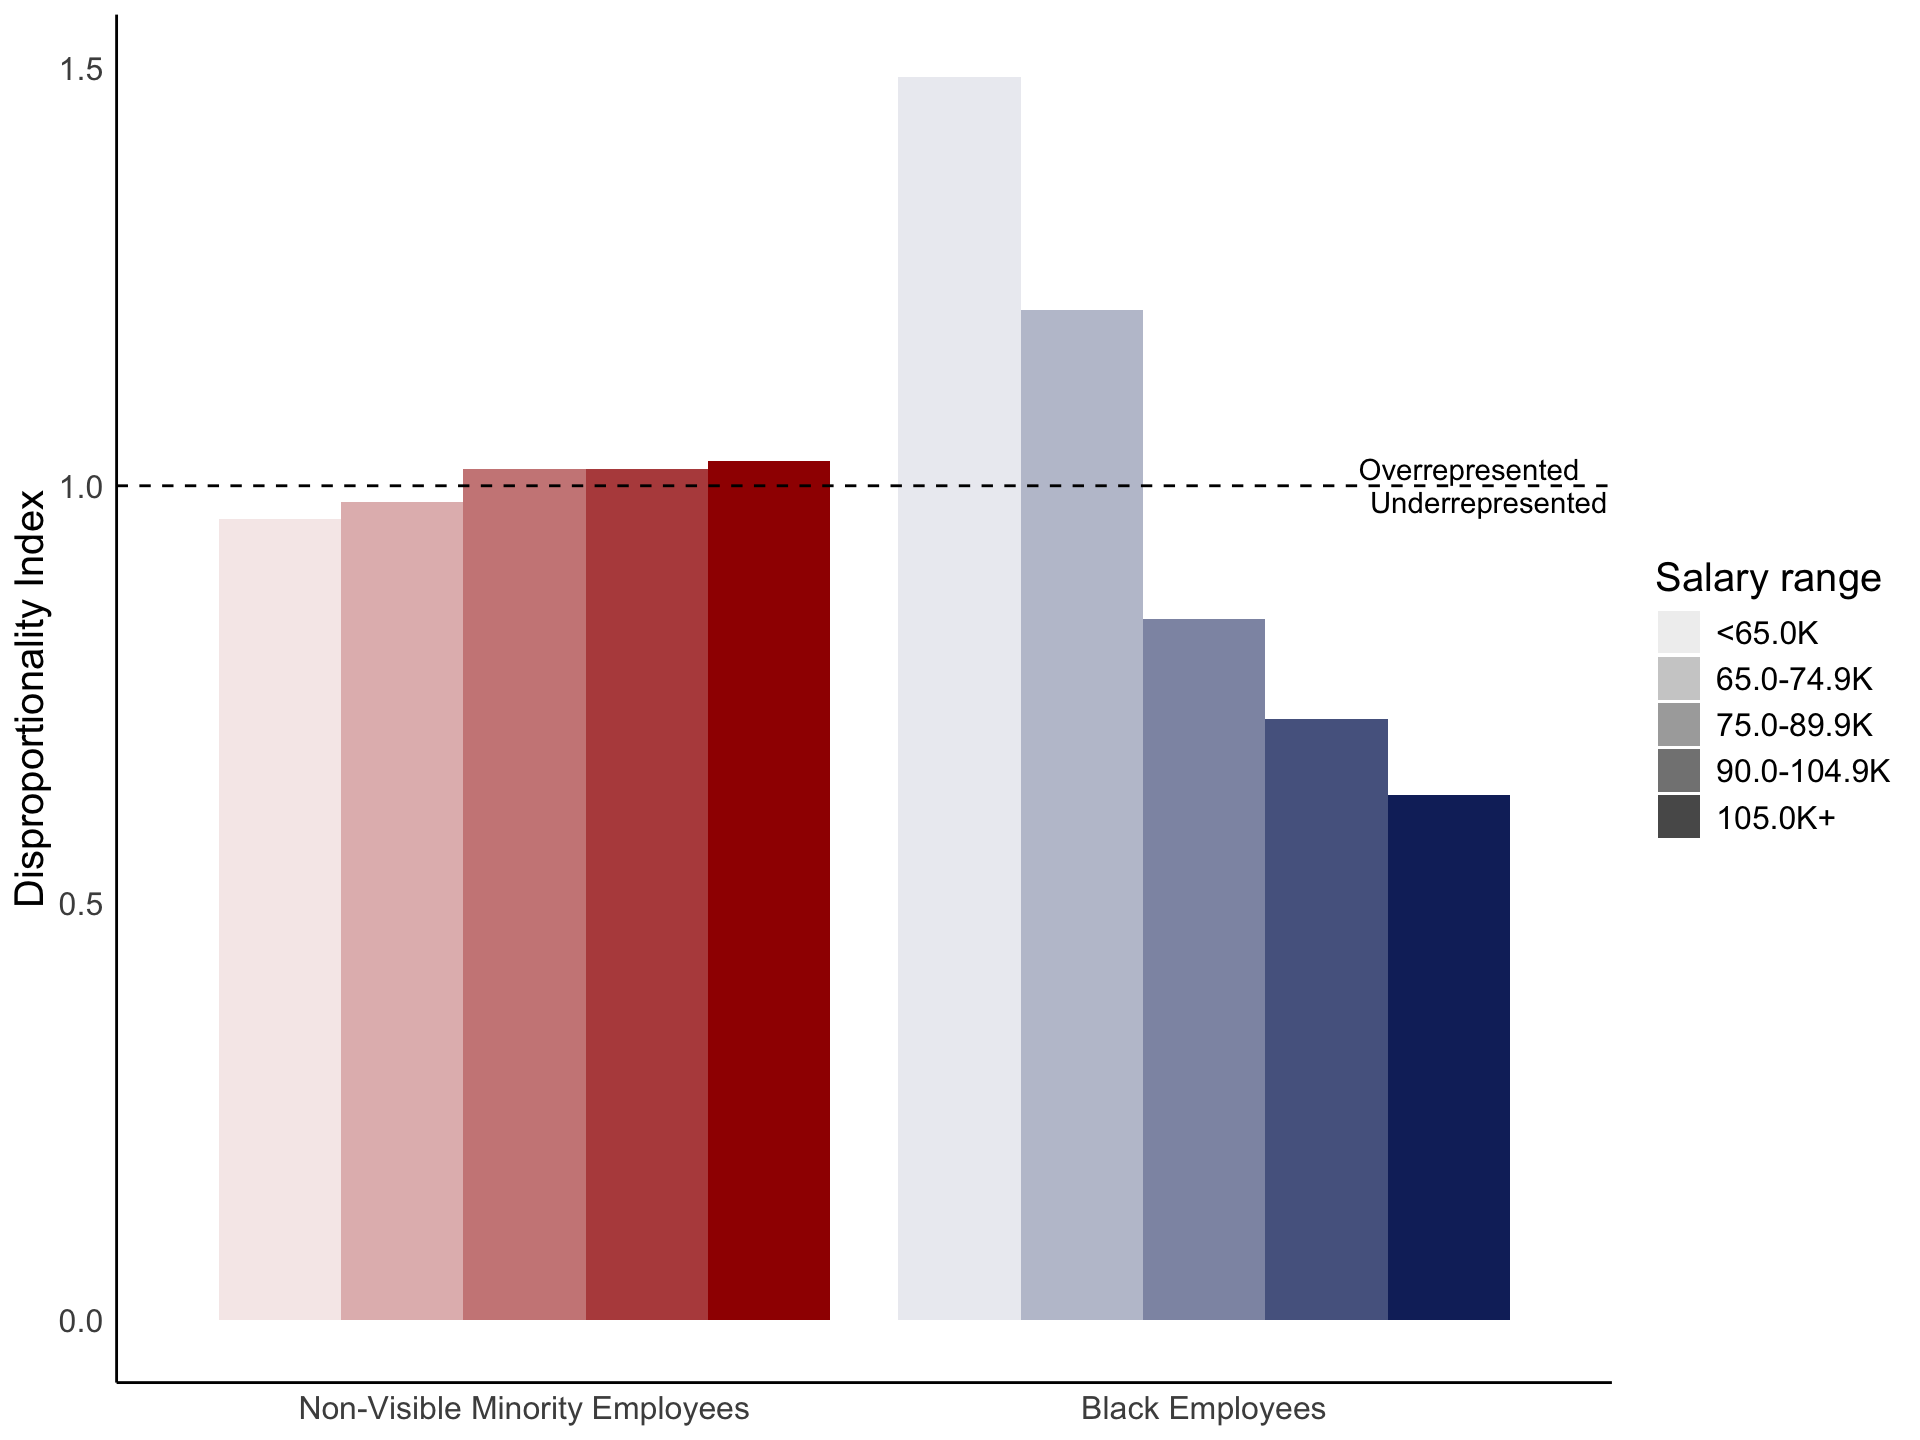
Plot 1: DI of all groups by salary range (2024)
The dotted line represents equitable representation (a DI of 1). It can been seen that Black employees are overrepresented at the lower salary ranges and underrepresented at higher ranges compared to the other groups. As can be seen by the “Non-Visible Minority Employees” bars, an equal DI across all salary ranges should be expected.

Plot 2: A direct comparison of DI in Black Employees vs. Non-Visible Minority Employees (2023)
This plot zooms in on our “baseline” group and compares it to the Black employee group, which appears to be the most affected by inequity. A steady decrease in representation with each increase in salary range is clearly visible for the Black employee group.

Plot 3: Interactive DI Visualization
Here you can select years and groups to display. Click the drop down on the left to filter by year. Click each group’s text under the subgroup heading on the right to remove and add data. Use your mouse to select a section to zoom into. You can also hover over each bars to see each individual data point.
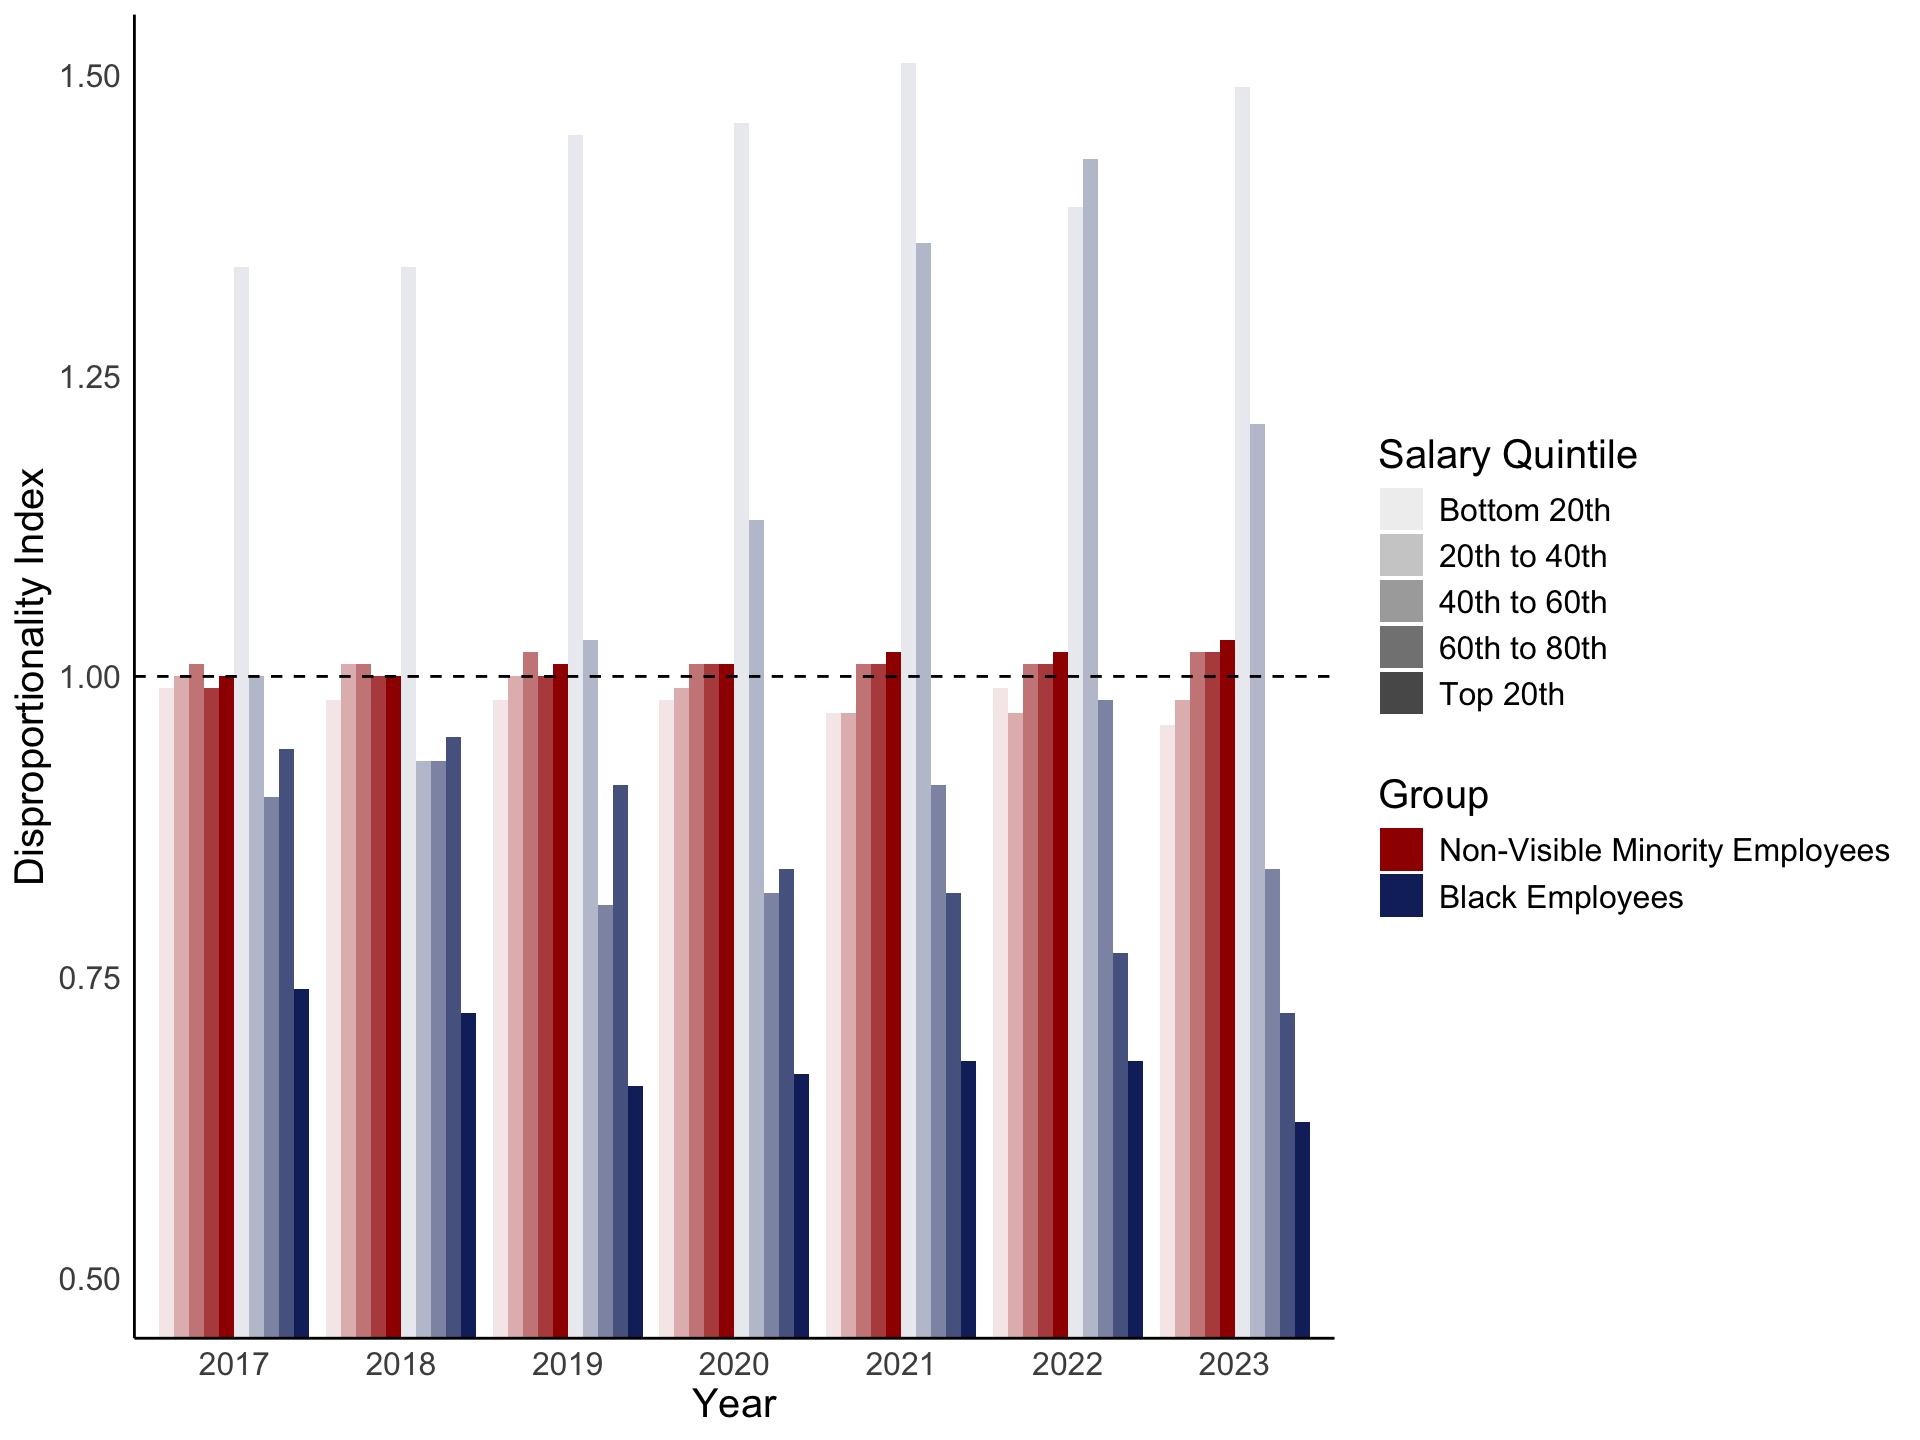
Plot 4: A direct comparison of DI in Black Employees vs. Non-Visible Minority Employees Over All Years (2017-2024)

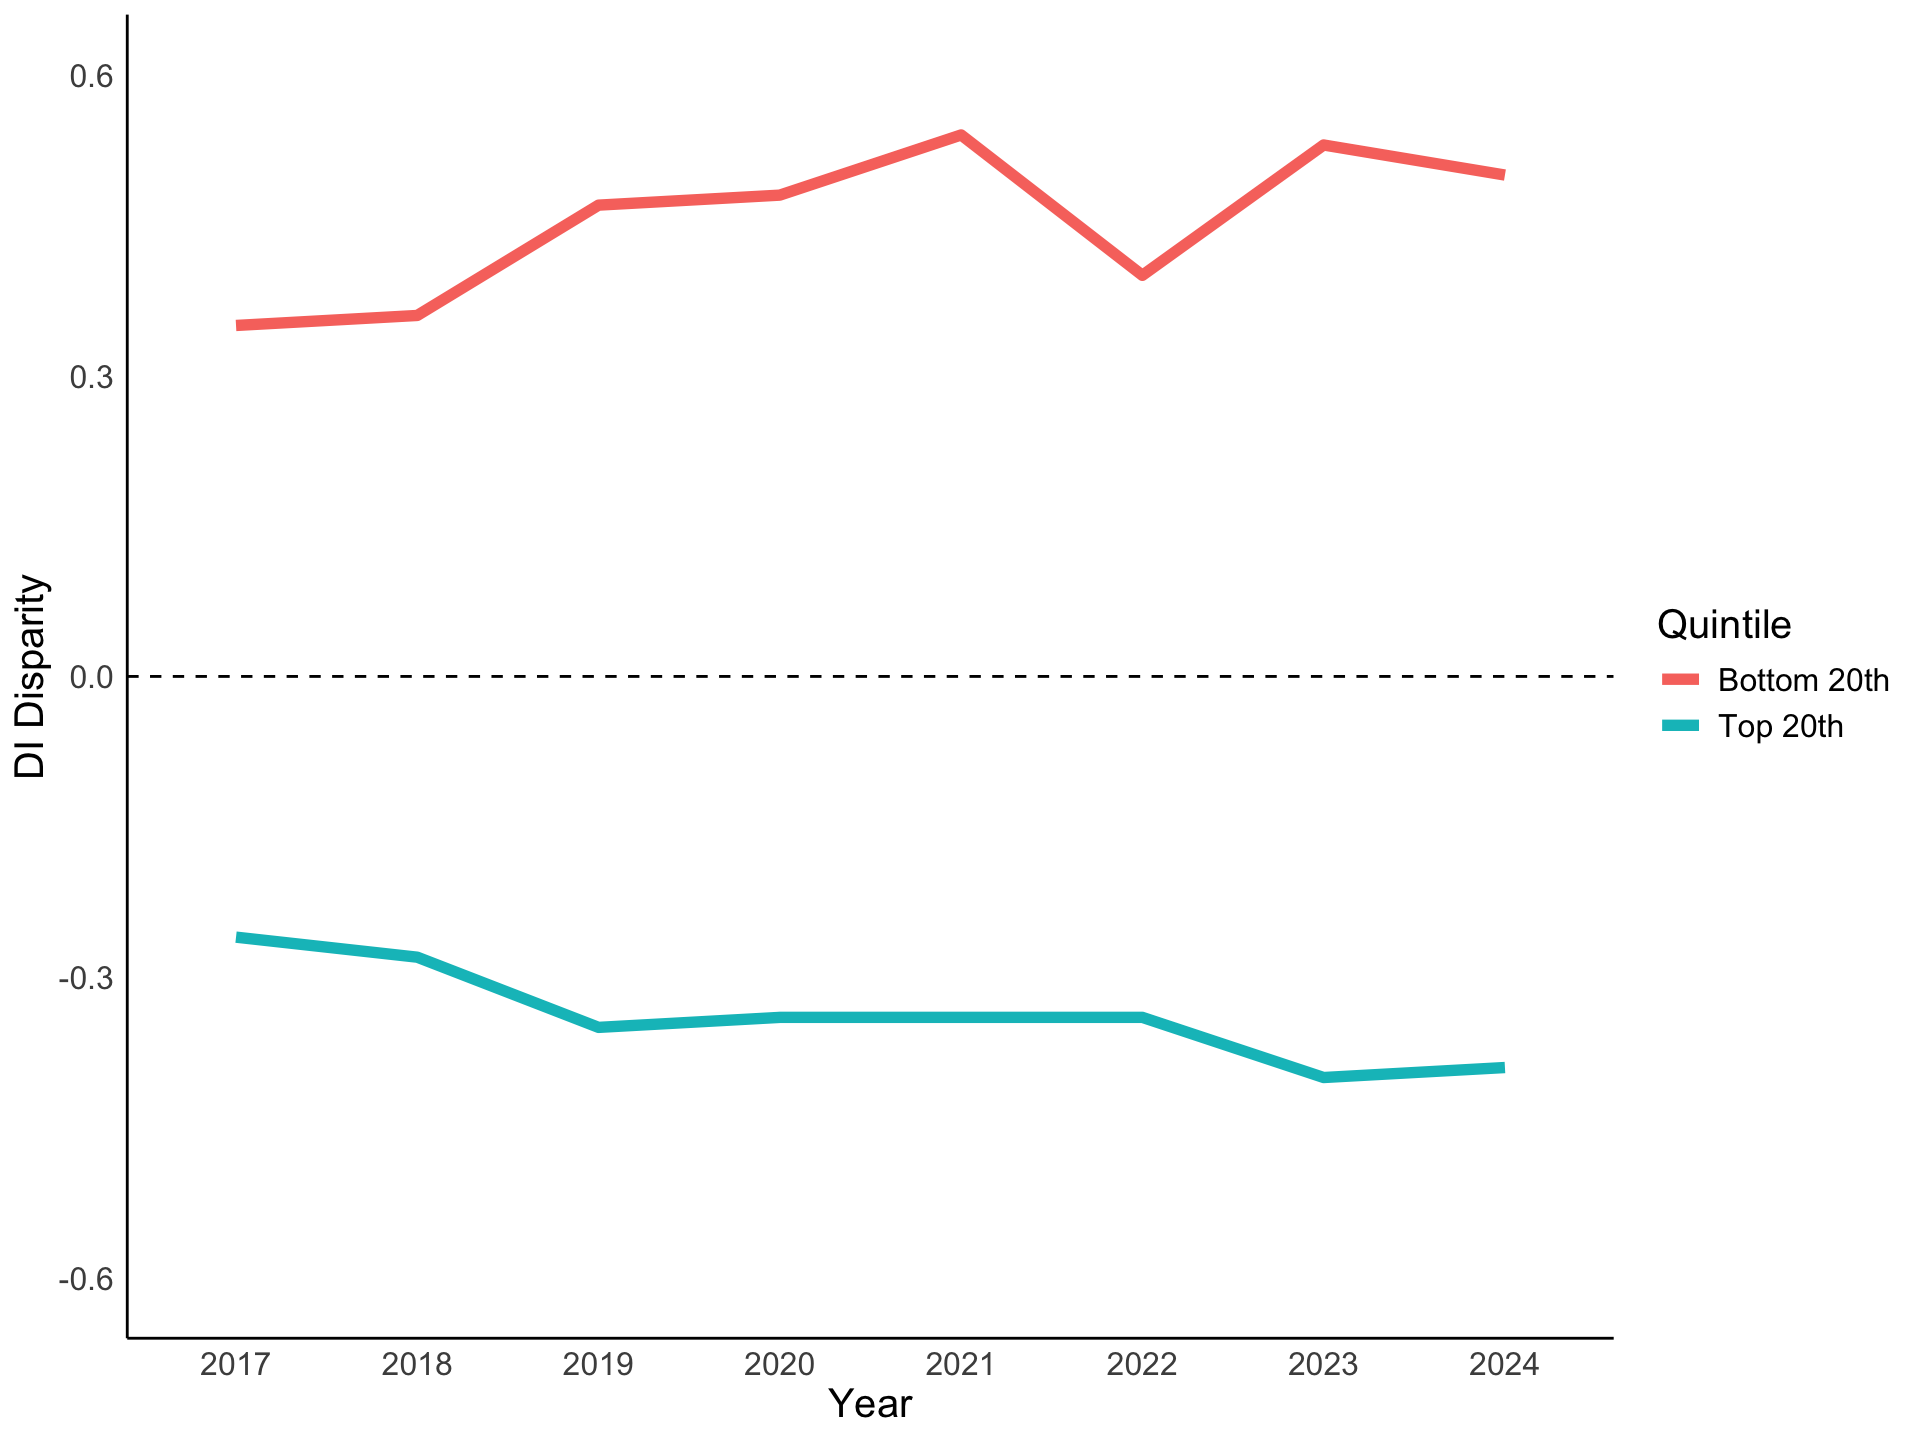
Plot 5: Disparity between Non-visible Minority Employees and Black Employees Over Time (2017-2024)
In this plot, DI disparity is calculated by subtracting the DI of Black employees from that of non-visible minority employees. It can be seen that the difference between the highest and lowest salaries percentiles are more or less remaining equal over time, with a small positive trend.
